In 2013, Eugene Fama, Lars Hansen, and Robert Shiller won the Nobel Prize in Economics. It was an odd trio, given that Fama is one of the fathers of the efficient markets theory and Shiller wrote a book titled 'Irrational Exuberance' in which he discussed the irrationally high stock prices shortly before the crash of 1999. The three were given the prize based on their careers' work of asset price prediction. Fama's work has focused on the difficulty of predicting stock prices in the short-run. Shiller, on the other hand, has focused on long-run predictions based on current valuations- as an investor would.
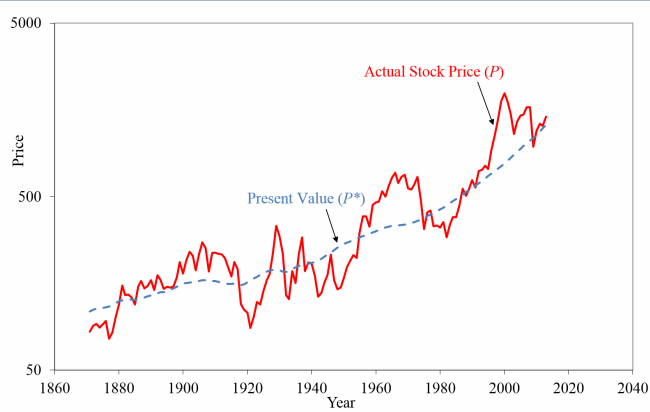
Shiller's work is particularly relevant to us, as it provides an empirical basis on which long-term predictions regarding asset prices can be made- for the general market in particular. A stock's fair value is the present value of all future free cash flows which will accrue to it. In the very long-run, those free cash flows must be eventually paid as dividends for them to be of value to the owner of the business. On this basis, Shiller developed a chart of the fair value of the S&P 500 by taking the future dividends of the index and determining the present value of them at each year since 1860.
Since Shiller created this chart in 2013, the present value of dividends after that were estimated based on the previous year's growth rate. For all years before 2013 we have future historical dividends on which to make this fair value claim. The dotted blue line indicates the fair value of these dividends for the S&P 500 over time. As we can see, the fair value of the index increases quite smoothly as the companies within the index compound earnings and pay higher dividends. The red line is the S&P 500 index price- much more volatile and ever changing. It is nearly always inaccurate by a decent margin. As we know, these stock price changes, even in the entire market index, are irrational, misguided, and not based on business values.
The question relevant to us as investors is how to determine whether the market as a whole is fairly priced or not. This of course, doesn't affect our individual investment decision- if a company is cheap we still buy it. It does however, give us an indication of future returns accruing to the general market and what we can expect going forward. Instead of valuing the index (as this depends on one's personal required rate of return), we can simply look at another chart Shiller made which presents his modified version of a P/E ratio along with the next 10 year returns of the index if purchased at that price to earnings ratio since 1883. This will help us determine our potential range of returns over the next 10 years based on historical data.
The modified P/E is called the Shiller CAPE ratio, which stands for the Cyclically Adjusted Price-Earnings ratio. This basically means that it leaves the asset price in the numerator, but instead of presenting the prior year's earnings in the denominator, it uses an average of the past 10 year's earnings. As I have said numerous times on this blog, P/E ratios can be extremely misleading and inaccurate in terms of valuing individual companies, but P/E's work well on average. Of course, the S&P 500 index is a weighted average of the largest 500 companies in America and its earnings grow at a very low rate, so in this case, P/Es are quite accurate for valuation purposes.

As of 8/23/2017, the S&P 500 index is trading at $2,444 per share and has earned approximately $100 per share over the past 12 months (based on data from S&P Dow Jones). Its P/E using earnings from the past 12 months would be about 24, and its CAPE P/E is approximately 30. As the chart above shows, since 1883, the highest next 10 year annual returns from purchasing the S&P 500 (or its 1800's equivalent) at a CAPE P/E of 30 was about 6%.
If you are currently holding the S&P 500 index and expect an annual return higher than 6% over the next 10 years, you are betting on beating the highest returns ever achieved from purchasing the index at this price. If this is the case, I would advise you to reduce your expectations. From a cursory look at the chart, you will likely achieve anywhere from -4 to 6%.
The chart is quite muddled at a CAPE P/E between 15 and 25, for reasons based on differing time periods, wars, economic growth rates, political outcomes, and other. At the extremes however, the model becomes much clearer. If you were to buy the index at anything lower than a CAPE P/E of 10 you would likely have done very well, and if you were to purchase it at a CAPE P/E over 30 you would likely have done extremely poorly over the next 10 years.
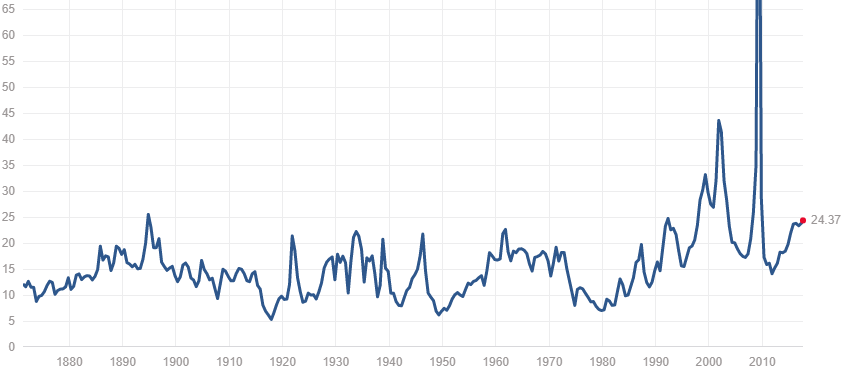
Something else we can look at is the CAPE P/E over time. Below is the chart of this. As you can see, we now have the same CAPE P/E valuation as we did in 1929, and only in the late 1990's was it ever higher.

If you're asking why I use the CAPE P/E instead of the normal trailing year P/E, it's because it smooths out earnings of prior years and it has more predictive power. The normal P/E chart shown below looks a tad better, but again, only in the late 1990's were valuations higher (and 2009 which doesn't exactly count because this is simply the result of prices dropping but total market earnings dropping at a faster rate to nearly 0). The long-run historical P/E looks to be around 15 or so, which would indicate a current price of around $1500.
The S&P 500 is comprised of the largest and most successful companies traded on U.S. public equity markets. As a result, it would be unwise to expect their earnings to grow at a high rate- more likely that they would grow slower than that of the total economy right? It would seem irrational to expect the largest 500 companies in the economy to grow faster than the entire economy, and history shows they have grown a bit slower- around 2-3% annually. With the entire economy growing at around 2% annually, we couldn't expect the earnings of the S&P 500 to grow any faster than that 2% or so. So, by purchasing the S&P 500, you are paying around $24 for every $1 of 2016 earnings it generated ($30 for every $1 it generated on average in the past 10 years) and as a whole it grows earnings at 2% or so per annum. There is no feasible way for such an asset, purchased at such a price, to produce anything near 10% annual returns.
Further, interest rates tend to act as a lever to lift or weigh down asset prices. As interest rates drop, the yields of assets (earnings / price) look more attractive in comparison and so the prices of those assets rise and vice versa if interest rates rise. Historically, this relationship is not so clear, but in theory it holds. Over the past 8 years, interest rates have been rock-bottom and historically low as shown below. This near-zero interest rate increases the value of all assets, including stocks, bonds, and real estate. (Not to mention the fact that debt is cheaper so people are more willing to take it on in order to purchase such assets at more expensive prices).

In any case, interest rates could not be lowered to induce asset price inflation as we historically have done in times of recession. This situation is called a liquidity trap- when interest rates are already so low that the Fed is unable to effectively conduct its monetary goals. The Fed will not be of much help if these asset prices were to significantly decline.
If you look closely at the forward ten year returns versus CAPE P/E chart again, you can see that at a CAPE P/E of 30, the highest annual 10 year forward returns of around 6% were achieved in the 1980's, 1910s-1920s, and the late 1800's. In the late 1800's through the 1920's, the GDP of the U.S. was growing at a higher rate than it is now. In the 1980's interest rates dropped from mid-to-high teens to mid single digits, and that helped boost stock prices dramatically over that period. Right now, investors of the S&P 500 do not have either of those benefits, which is why I would suggest that the returns of the next 10 years will be on the lower end of the range of historical values- my optimistic guess would be 2-3% per year.
Nobody can predict the movement of stock prices in the short-term (less than a few years), but Shiller was one of the three Nobel laureates in 2013 because he helped explain why stock prices over the long-run are quite predictable. It all depends on the future performance of the stock versus its current price- on this basis we can tell whether the general market is cheap, fairly priced, or expensive. It should be clear from this quick analysis that it is historically expensive. The higher the price you pay for a financial asset, the lower the future returns and vice versa. The earnings of the S&P 500 are quite slowly growing, so determining potential future returns from this index is not complex.
As market indices continue to rise, studies of investor expectations have shown that investors increasingly expect higher performance as a result of new-found record market index prices and feel that the chance of a recession is ever lower. When others become complacent and/or greedy, the prudent investor should become more aware and fearful. If you find yourself expecting substantial future performance from the S&P 500 or any other U.S. market index based on the results of recent history, be aware that you are betting against both history and logic.